Holdings and Market Value
Largest Public Equity Direct Holdings at December 31, 2025
MainePERS employs a passive “buy the market” approach for its investments in public equity markets, allowing the System to earn market returns at very low cost while maintaining a very high level of diversification. In order to mirror the overall market, investments in individual companies are made proportionate to each company’s share of the market. As a result, the System’s top 10 holdings shown below correspond to the 10 largest U.S. public companies.
| Top 10 Equity Holdings | Market Value |
|---|---|
| Nvidia | $ 258,081,311 |
| Apple | $ 234,342,233 |
| Microsoft | $ 212,072,206 |
| Alphabet | $ 195,392,212 |
| Amazon | $ 130,916,718 |
| Broadcom | $ 94,507,797 |
| Meta Platforms | $ 85,214,979 |
| Tesla | $ 75,028,137 |
| Berkshire Hathaway | $ 54,815,490 |
| JP Morgan Chase | $ 51,755,621 |
| Top 10 Equities | $1,392,126,704 |
Historical Holdings Data
Holdings are updated quarterly. Private Market holdings are reported with a one-quarter lag.
Public Market Holdings
2025 – Q4 (EXCEL)
2025 – Q3 (EXCEL)
2025 – Q2 (EXCEL)
2025 – Q1 (EXCEL)
2024 – Q4 (EXCEL)
2024 – Q3 (EXCEL)
2024 – Q2 (EXCEL)
2024 – Q1 (EXCEL)
2023 – Q4 (EXCEL)
2023 – Q3 (EXCEL)
2023 – Q2 (EXCEL)
2023 – Q1 (EXCEL)
2022 – Q4 (EXCEL)
2022 – Q3 (EXCEL)
2022 – Q2 (EXCEL)
2022 – Q1 (EXCEL)
2021 – Q4 (EXCEL)
2021 – Q3 (EXCEL)
2021 – Q2 (EXCEL)
2021 – Q1 (EXCEL)
2020 – Q4 (EXCEL)
2020 – Q3 (EXCEL)
2020 – Q2 (EXCEL)
2020 – Q1 (EXCEL)
Private Markets Holdings
2025 – 03 (PDF)
2025 – Q2 (PDF)
2025 – Q1 (PDF)
2024 – Q4 (PDF)
2024 – Q3 (PDF)
2024 – Q2 (PDF)
2024 – Q1 (PDF)
2023 – Q4 (PDF)
2023 – Q3 (PDF)
2023 – Q2 (PDF)
2023 – Q1 (PDF)
2022 – Q4 (PDF)
2022 – Q3 (PDF)
2022 – Q2 (PDF)
2022 – Q1 (PDF)
2021 – Q4 (PDF)
2021 – Q3 (PDF)
2021 – Q2 (PDF)
2021 – Q1 (PDF)
2020 – Q4 (PDF)
2020 – Q3 (PDF)
2020 – Q2 (PDF)
2020 – Q1 (PDF)
Risk Diversifiers
2025 – 04 (EXCEL)
2025 – Q3 (EXCEL)
2025 – Q2 (EXCEL)
2025 – Q1 (EXCEL)
2024 – Q4 (EXCEL)
2024 – Q3 (EXCEL)
2024 – Q2 (EXCEL)
2024 – Q1 (EXCEL)
2023 – Q4 (EXCEL)
2023 – Q3 (EXCEL)
2023 – Q2 (EXCEL)
2023 – Q1 (EXCEL)
2022 – Q4 (EXCEL)
2022 – Q3 (EXCEL)
2022 – Q2 (EXCEL)
2022 – Q1 (EXCEL)
2021 – Q4 (EXCEL)
2021 – Q3 (EXCEL)
2021 – Q2 (EXCEL)
2021 – Q1 (EXCEL)
2020 – Q4 (EXCEL)
2020 – Q3 (EXCEL)
2020 – Q2 (EXCEL)
2020 – Q1 (EXCEL)
Some of the System’s index fund investments are made through commingled funds, with MainePERS owning units of the funds, and having beneficial, rather than direct ownership of the securities. The largest holdings list reports direct holdings held outside those commingled funds.
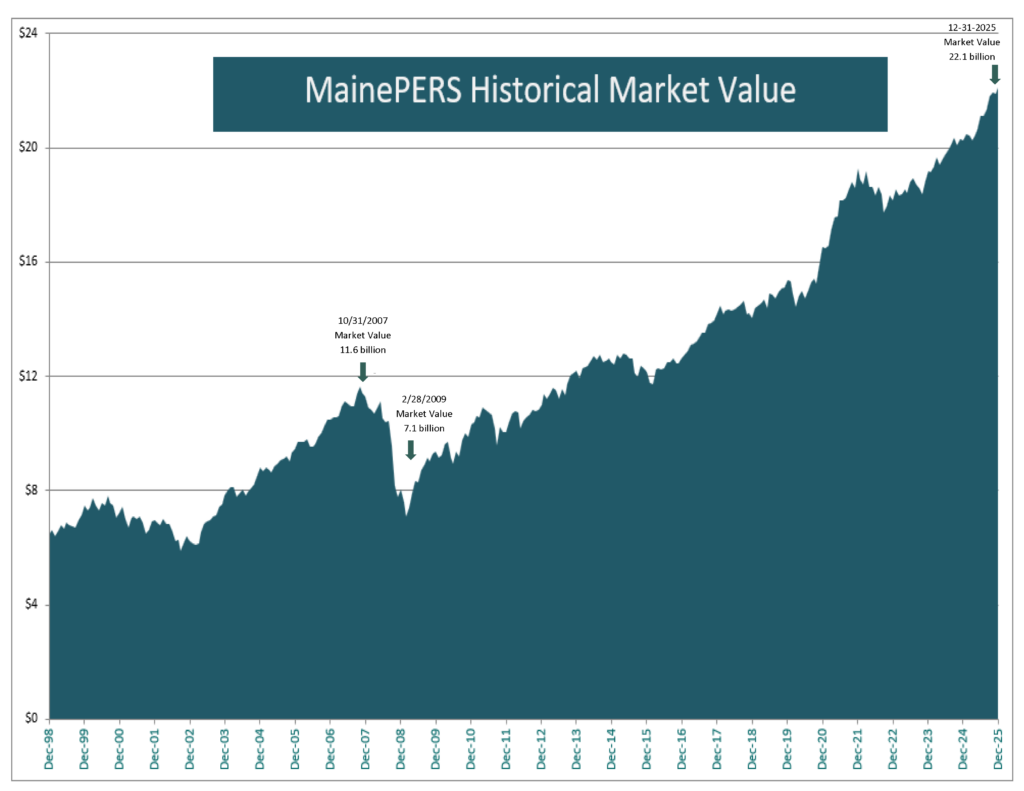
Market Value
The chart below shows the monthly market value for MainePERS. The market value reflects unrealized gains and losses as well as cash flows for the fund.